

Key Takeaways
- Speed limits are set through traffic engineering analysis, not arbitrarily chosen numbers.
- The 85th-percentile speed method is widely used but debated among safety researchers.
- Posted limits represent maximum legal speeds under normal conditions - not targets or suggestions.
- Conditions like weather, darkness, or construction legally require reducing speed below the posted limit.
- Misreading speed limits is a common driver error that contributes to real enforcement and safety consequences.
Posted Speed Limit
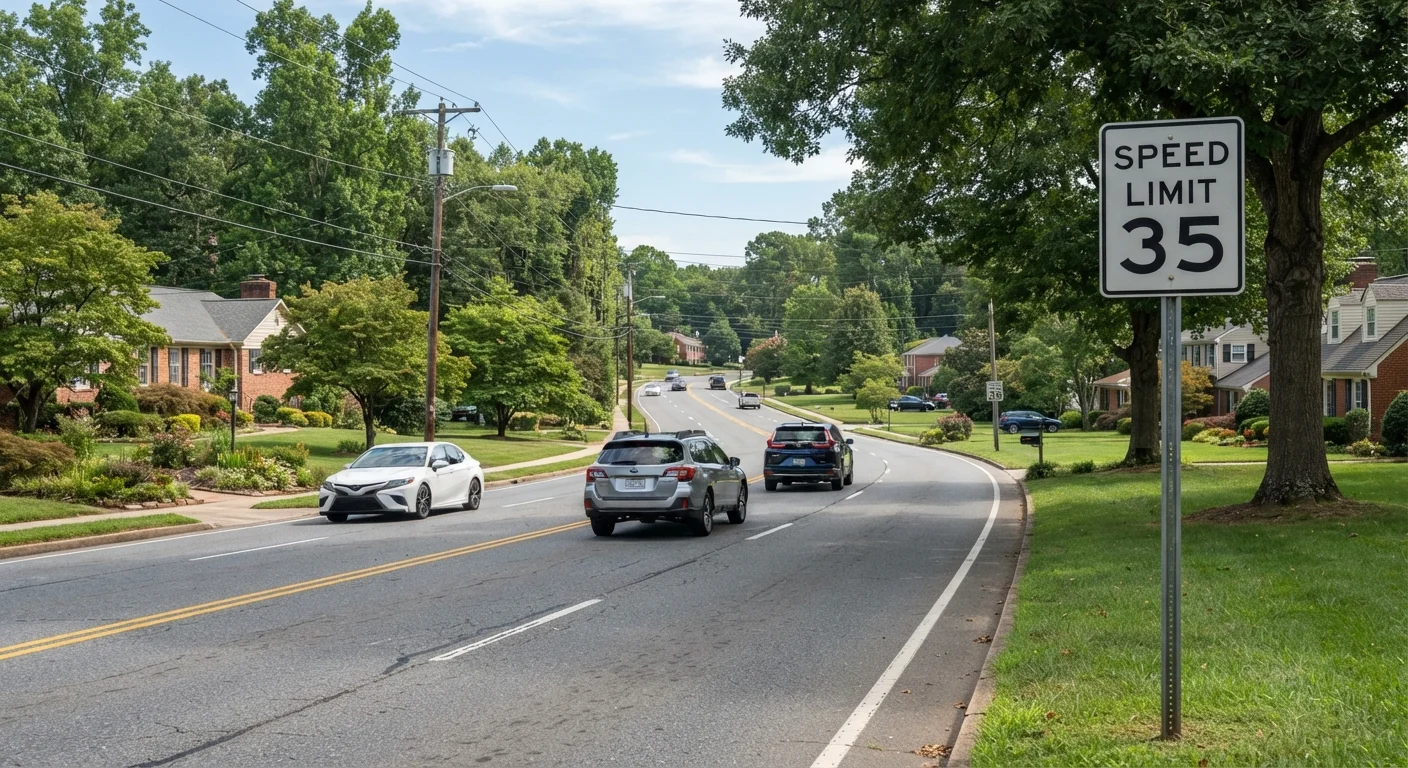
A posted speed limit is the maximum legal speed a driver may travel on a given road segment under normal conditions. These limits are set by state and local authorities using traffic engineering data and federal guidelines. They are regulatory signs - meaning compliance is required by law, not optional.
Most US speed limits are established using studies of roadway geometry, crash history, and observed traffic flow, often referencing the 85th-percentile speed - the speed at or below which 85% of vehicles travel under free-flow conditions.
How Traffic Engineers Determine Speed Limits
Speed limits don't emerge from a general sense of what seems fast enough. They result from a structured engineering process that weighs multiple variables: road geometry (curves, grades, lane width), sight distance, crash history, land use along the corridor, and the speeds drivers actually choose under uncongested conditions.
The most widely referenced tool is the 85th-percentile speed - a measurement taken from a sample of vehicles traveling a road segment freely, without congestion. The speed at or below which 85% of those drivers operate is used as a benchmark for setting the posted limit. The underlying assumption is that the majority of drivers make reasonable speed choices based on what the road feels like.
Federal guidelines from the MUTCD provide a national framework, but states retain the authority to set and modify limits on roads within their jurisdiction. That's why limits vary from state to state even on similar road types.
85th
Percentile speed benchmark used by engineers
Traffic engineers traditionally use the speed at or below which 85% of drivers travel as a primary input for setting posted speed limits.
~29%
Fatal crashes involving speeding
According to the National Highway Traffic Safety Administration (NHTSA), speeding is a contributing factor in roughly 29% of all traffic fatalities annually in the United States.
2x
Typical fine multiplier in school and work zones
Most US states double standard speeding fines in designated school zones and active highway work zones.
It's also worth noting that the 85th-percentile method is not without criticism. Some transportation safety researchers argue it can result in higher-than-appropriate limits - particularly in areas with significant pedestrian activity or residential density. Many jurisdictions now supplement engineering data with safety-based criteria, especially near schools and in urban zones.
What Posted Limits Actually Mean - Legally
A posted speed limit sign is a regulatory sign - white background, black text - and it carries the force of law. This distinguishes it from advisory speed signs (yellow background), which indicate a recommended speed through a curve or transition and are not enforceable as hard limits. The difference between regulatory and advisory signs is one that many drivers overlook.
Legally, the posted number represents the maximum speed permitted under normal conditions. It is not a floor, and it is not a target. Most states also have a "basic speed law" or "reasonable and prudent" standard, which means a driver can be cited for traveling at an unsafe speed even when driving at or below the posted limit - if road conditions such as rain, ice, fog, or construction make that speed unreasonable.
Slow Down Before the Sign, Not After
When approaching a known speed reduction - a school zone, a town center, a construction corridor - begin decelerating before you reach the new limit sign. The limit is active as soon as you pass the sign, and law enforcement commonly positions in areas just beyond speed transitions. Gradual deceleration is also safer for traffic behind you.
School zone limits and construction zone limits carry additional weight: fines are typically doubled in these areas, and enforcement is often heightened. These reduced limits apply during specified hours or when workers are present, depending on state law.
Common Misreadings That Lead to Violations
Even attentive drivers misread speed limit situations more often than they realize. A few patterns stand out:
- Assuming a limit carries forward: Drivers often continue at a higher speed after a limit changes, especially when the new sign is positioned just before or within a zone that looks similar. Speed limits can change abruptly as land use shifts.
- Confusing advisory signs with regulatory ones: Yellow curve signs with a recommended speed are not enforceable speed limits - but treating a white regulatory sign the same way is a legal mistake.
- "Keeping up with traffic" as a defense: Following the speed of surrounding vehicles doesn't provide legal cover. If the posted limit is 45 mph and surrounding traffic is moving at 60 mph, a driver can still be cited.
- Misapplying the posted limit at night or in bad weather: Conditions after dark, in rain, or in fog may require speeds well below the posted limit to maintain adequate stopping distance. Night driving introduces risks that posted daytime limits were not designed to account for.
Understanding how limits are set also supports broader safe driving habits. Just as merging and lane-change rules are frequently misunderstood, speed regulation is an area where assumptions tend to drift from the legal and engineering reality.